Tracing Express Services with zipkin-js

Tracing Express Services with zipkin-js
In the last few years, microservices architectures have become mainstream. The pattern solves many problems of the monolithic architecture design but has some drawbacks, one of the biggest being how hard it is to debug the system.
Distributing tracing is one of the best tools you can have in your belt when dealing with microservices. Tracing helps you know what is happening in your system and which parts are involved, even in production.
In this article, we will build a couple of Express microservices and use zipkin-js to trace them. You will need:
- Docker to start a Zipkin instance
- Node.js installed
In this GitHub repository, you can find the complete example.
Getting our Zipkin instance up
First, we must define our Zipkin instance in a docker-compose.yml file. We need two containers; a MySQL database for storage and Zipkin itself:
version: '2'

services:
  storage:
    image: openzipkin/zipkin-mysql
    container_name: zipkin-playground-mysql
    environment:
      - MYSQL_HOST=mysql

  zipkin:
    image: openzipkin/zipkin
    container_name: zipkin-playground-zipkin
    environment:
      - STORAGE_TYPE=mysql
      - MYSQL_HOST=zipkin-playground-mysql
    ports:
      - 9411:9411
    depends_on:
      - storage
After that, we can get our instance up with the command docker-compose up.
Building an Express microservice
Next, we will write a plain Express service. Our service has a /time endpoint that sends a JSON with the current date:
const express = require('express');

const app = express();
const port = process.env.PORT || 3001;

app.get('/time', (req, res) => {
  res.json({ currentDate: new Date().getTime() });
});

app.listen(port, () => console.log(`Date service listening on port ${port}`));
To start tracing our Express app with zipkin-js, we need some extra libraries. We are going to use zipkin-instrumentation-express and zipkin-transport-http. The former is an Express middleware, and the latter is a transport to send the traces to Zipkin via HTTP:
const express = require('express');

// Import zipkin stuff
const {
  Tracer,
  ExplicitContext,
  BatchRecorder,
  jsonEncoder,
} = require('zipkin');
const { HttpLogger } = require('zipkin-transport-http');
const zipkinMiddleware =
  require('zipkin-instrumentation-express').expressMiddleware;

const ZIPKIN_ENDPOINT = process.env.ZIPKIN_ENDPOINT || 'http://localhost:9411';

// Get ourselves a zipkin tracer
const tracer = new Tracer({
  ctxImpl: new ExplicitContext(),
  recorder: new BatchRecorder({
    logger: new HttpLogger({
      endpoint: `${ZIPKIN_ENDPOINT}/api/v2/spans`,
      jsonEncoder: jsonEncoder.JSON_V2,
    }),
  }),
  localServiceName: 'date-service',
});

const app = express();
const port = process.env.PORT || 3001;

// Add zipkin express middleware
app.use(zipkinMiddleware({ tracer }));

app.get('/time', (req, res) => {
  res.json({ currentDate: new Date().getTime() });
});

app.listen(port, () => console.log(`Date service listening on port ${port}`));
It may seem like a lot of code, but we are just creating a Tracer instance and adding the middleware to the Express app. The tracer can be configured using the constructor parameters, but we are not getting into these details for this example.
This is all that is needed to get tracing working. If we now make a request to localhost:3001/time, a trace will be sent to our Zipkin endpoint.
You can now go to localhost:9411/zipkin/, and you should be able to see something similar to this:
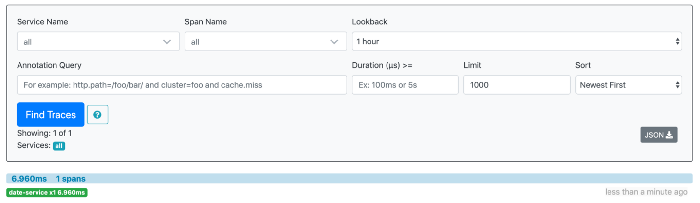
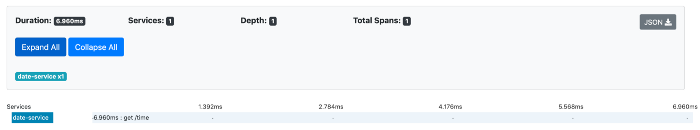
If we click the trace, we get a detailed view of it:
Communication between services
Things start getting more interesting when we interact with more than one service. We will write a new service requesting the current date to our existing date service and then use the result to render some HTML.
We will use Axios as our HTTP client to make the request and pug to render our template.
To get Axios working with Zipkin, we need to instrument it. We can do this with the zipkin-instrumentation-axios library.
The code for the service looks like this:
// This lives in views/index.pug
html
  head
    title= "What time is it?"
  body
    h1= date
const express = require('express');

// Import axios and axios instrumentation
const axios = require('axios');
const zipkinInstrumentationAxios = require('zipkin-instrumentation-axios');

// Import zipkin stuff
const {
  Tracer,
  ExplicitContext,
  BatchRecorder,
  jsonEncoder,
} = require('zipkin');
const { HttpLogger } = require('zipkin-transport-http');
const zipkinMiddleware =
  require('zipkin-instrumentation-express').expressMiddleware;

const ZIPKIN_ENDPOINT = process.env.ZIPKIN_ENDPOINT || 'http://localhost:9411';
const API_ENDPOINT = process.env.API_ENDPOINT || 'http://localhost:3001';

// Get ourselves a zipkin tracer
const tracer = new Tracer({
  ctxImpl: new ExplicitContext(),
  recorder: new BatchRecorder({
    logger: new HttpLogger({
      endpoint: `${ZIPKIN_ENDPOINT}/api/v2/spans`,
      jsonEncoder: jsonEncoder.JSON_V2,
    }),
  }),
  localServiceName: 'web-service',
});

const app = express();
const port = process.env.PORT || 3000;

// Add zipkin express middleware
app.use(zipkinMiddleware({ tracer }));

// Add axios instrumentation
const zipkinAxios = zipkinInstrumentationAxios(axios, {
  tracer,
  serviceName: 'axios-client',
});

// We use pug to render the template
app.set('view engine', 'pug');

app.get('/', async (req, res, next) => {
  try {
    const result = await zipkinAxios.get(`${API_ENDPOINT}/time`);
    res.render('index', {
      date: new Date(result.data.currentDate).toLocaleTimeString(),
    });
  } catch (error) {
    next(error);
  }
});

app.listen(port, () => console.log(`Web service listening on port ${port}`));
This looks familiar. It is pretty much the same as we did before. We create a new Tracer instance and add the middleware to the service. We instrument Axios passing the Tracer instance and a name for the client.
Now, if we get both services up and make a request to localhost:3000, we can see a trace like this in Zipkin:
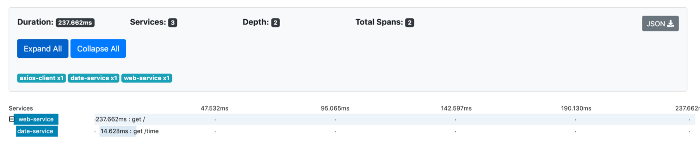
The instrumented HTTP client is forwarding some headers telling the date service, ‘Yo! We are being traced; this is the trace identifier. Attach your stuff to it!’. When the date service receives these headers, instead of creating a new trace, it just attaches a span to the existing one.
Tracing local operations
We can make our traces more informative by tracing local operations performed by the services. In our example, we don’t have local operations worth tracing, so we will add some delays and trace these instead to see how it works:
// We can define a delay function with this one line
const delay = (ms) => new Promise((resolve) => setTimeout(resolve, ms));
// Our date service controller will look like this
app.get('/time', async (req, res) => {
  await tracer.local('awaiting 200ms delay', () => delay(200));
  res.json({ currentDate: new Date().getTime() });
});
// Our web service controller will look like this
app.get('/', async (req, res, next) => {
  try {
    await tracer.local('awaiting 100ms delay', () => delay(100));
    const result = await zipkinAxios.get(`${API_ENDPOINT}/time`);
    res.render('index', {
      date: new Date(result.data.currentDate).toLocaleTimeString(),
    });
  } catch (error) {
    next(error);
  }
});
If we make a request to our web service, the trace will look like this:
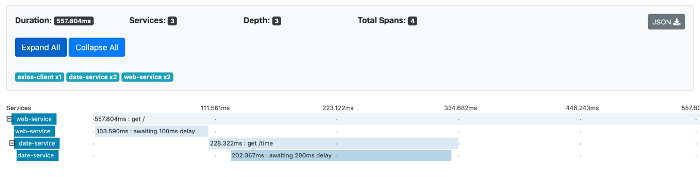
New spans are attached for local operations, and we can now understand what is happening just by looking at the trace.
Pretty neat, right?