Debugging Node.js Applications, Part Two.

In the first part of this series, we learned how debuggers work and how to attach our debugging client to our code. In this post, we will cover the basic features of the Chrome debugger.
Breakpoints
A breakpoint is a mark you can place anywhere in your code to pause its execution. You can set it by clicking the line number in the chrome debugger; alternatively, you could use the Javascript debugger statement anywhere in your code.
Inline breakpoints
Let us say we have a file name in dash-case format, and we want to drop the extension and convert it to camel-case:
// "my-file.js" => "myFile"
'my-file.js'
  .replace(/\.[^/.]+$/, '')
  .replace(/-([a-z0-9])/g, (g) => g[1].toUpperCase());
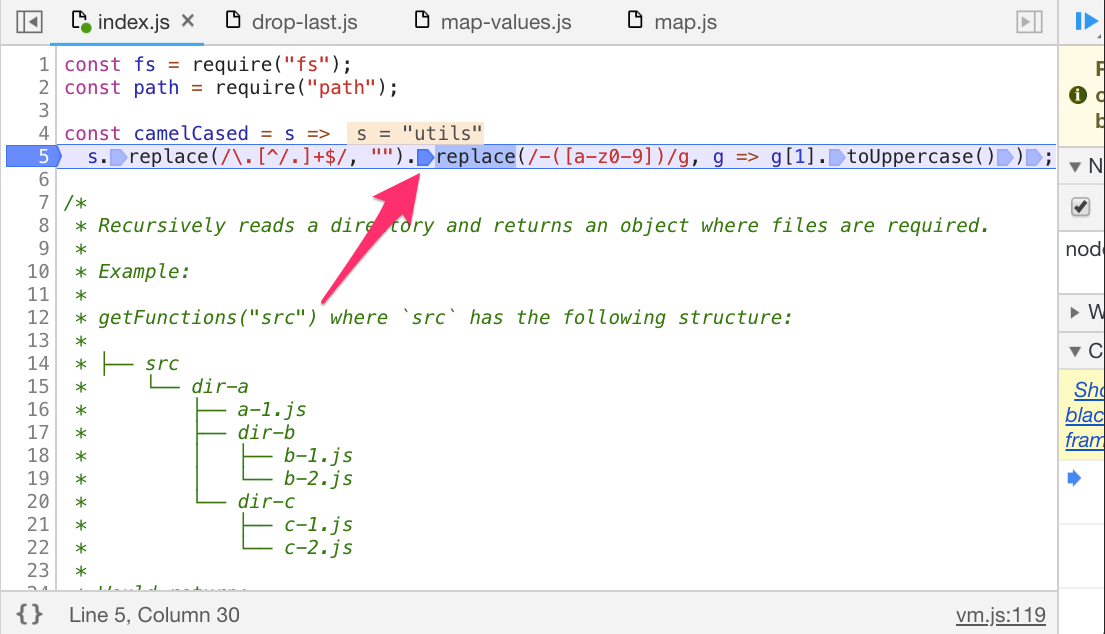
It is common in Javascript to chain calls in a single line like this. When we debug chained calls, we usually want to watch what happens at every step of the chain. The default debugger, however, only allows breakpoints in whole lines.
More advanced debuggers like the Chrome debugger have features allowing us to set inline breakpoints. In the Chrome debugger, when we set a breakpoint in a line with more than one call, there will be an arrow in front of each one indicating that we can break the execution down even further.
This is especially useful when we have a ternary operator and want to stop in one of the statements:
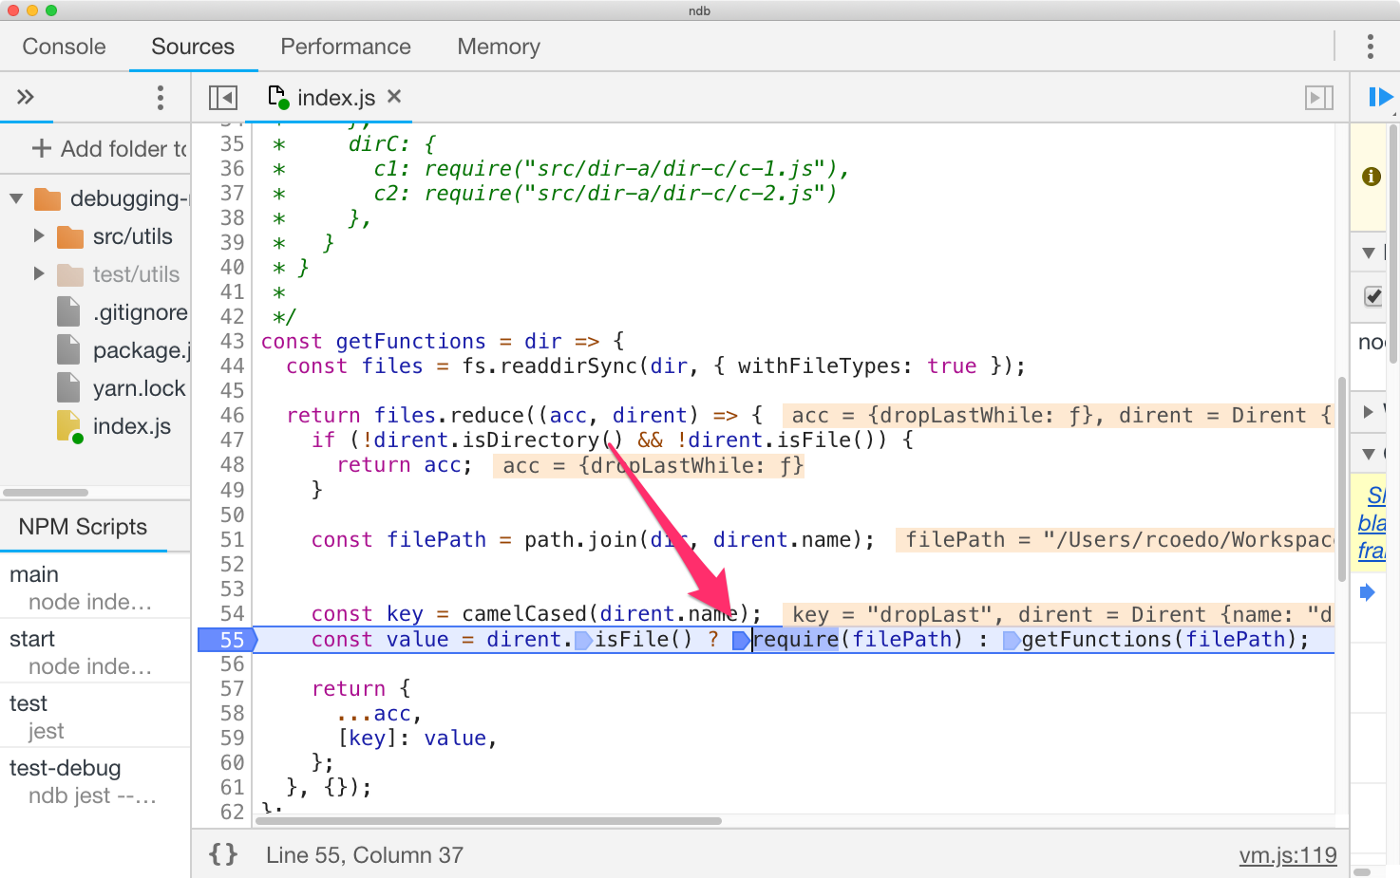
The execution pauses at the require.
Conditional breakpoints
A conditional breakpoint is a breakpoint that only stops the execution when a specific condition is met. This is especially useful when we are debugging loops and need to stop on a particular scenario:
Pausing on exceptions
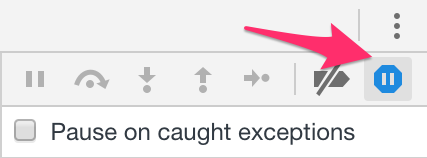
We can tell the debugger to pause execution when an exception is thrown. By default, the debugger will stop on uncaught exceptions only, but we can also choose to pause on caught exceptions if we need to.
We can activate this option using the button in the top-right menu:
Debugging tools
Once we are paused somewhere in the code, there are several tools we can use to navigate and analyze it. The debugger will give us contextual information, including defined variables, their values, and the call stack.
Stepping through our code
In the top-right menu, we have controls to continue executing the code in different ways:
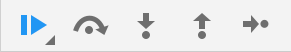
From left to right: Play, step over, step into, step out and step.
- The
playbutton will continue the execution until a new breakpoint is found or the program ends. - The
step overbutton will execute the following line of code, not stepping into function calls. - The
step intobutton will enter the current function call. - The
step outbutton will get you out of the current function call in the stack. - The
stepbutton will execute the following line of code.
The scope
In the right menu, we can find a section with the scope. The scope is the execution context of our code (everything that is defined) at that point in time. We can use the scope to analyze what variables are defined and their values.
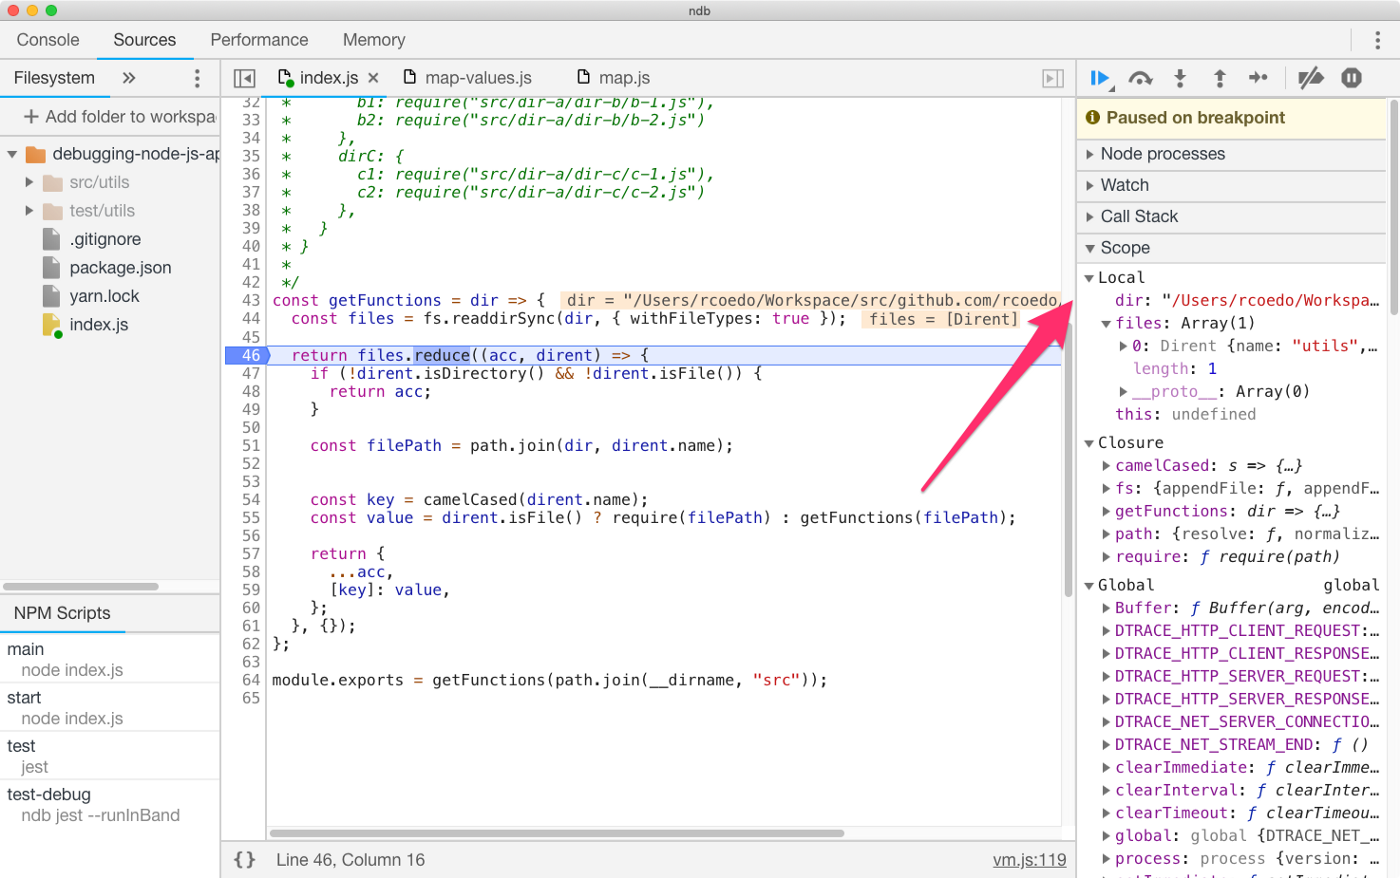
All defined variables will be listed here. We can check the local scope, the closured values, and the global scope.
Expression watching
One helpful tool when debugging is expression watching. In the Chrome debugger, we can define a set of expressions that will be evaluated on the fly, and their result will be shown. The cool thing is we can reference variables from the scope.
The REPL
While paused, we can access the Javascript console to evaluate code in the current execution context. We can show and hide the console with the escape key.
This is probably the most flexible tool in the debugger client since we can do almost anything we want here. However, avoid using it only for expression watching. The expression watchers are still more efficient since you can define them once and use them in more than one execution.
The call stack
In the right menu, we can find the call stack section. When navigating the call stack, we use this to discover why a function was invoked.
It is helpful in conjunction with the pause on exceptions option. In this scenario, the call stack will let us find which function call caused the exception.
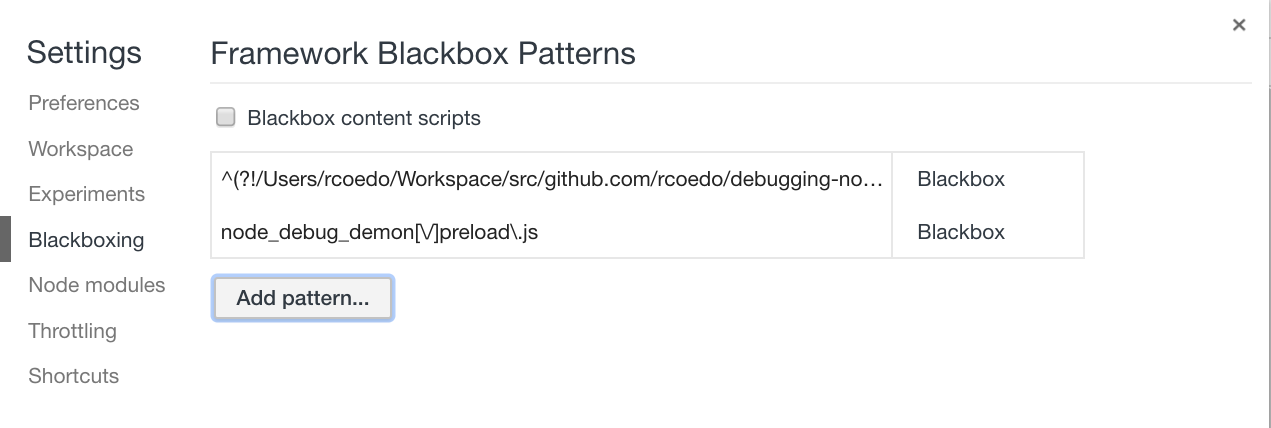
A word on black-boxing
When jumping around your code, sometimes you end up in source files you are not interested in, like source files from your node_modules.
Black-boxing allows you to ignore some scripts, so they will not show up when stepping through your code.
Some debuggers ignore the node_modules folder by default. You can choose to black-box any script you like in the Black-boxing tab in the Chrome debugger Settings panel.
Wrapping it up
These are the fundamentals of the Chrome debugger. Master these tools, and you will be able to find them pesky bugs in no time.
Enjoy!