Debugging Node.js Applications, Part One.

As developers, we frequently spend a hefty amount of time debugging. This is why knowing how to properly debug our code is crucial if we want to be productive.
In this series, we will kick the good old console.log out of our lives and learn how to debug node.js the right way.
Fundamentals
Before we begin, we must know that Node.js uses the Chrome V8 engine under the hood. The V8 engine is a low-level software written in C++ that translates our JS code to machine code.
The Chrome V8 engine implements the V8 Inspector Protocol or Chrome Debugging Protocol. It has been available since Node.js@6.3, providing debugging clients and a way to communicate with the engine.
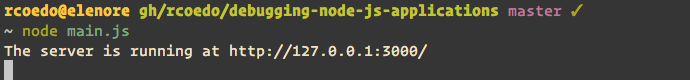
To demonstrate how we can debug our code, we will run a simple HTTP “Hello world” server in debug mode.
This is the code for the server:
const http = require('http');
const hostname = '127.0.0.1';
const port = 3000;

const server = http.createServer((req, res) => {
  res.statusCode = 200;
  res.setHeader('Content-Type', 'text/plain');
  res.end('Hello World\n');
});

server.listen(port, hostname, () => {
  console.log(`The server is running at http://${hostname}:${port}/`);
});
The built-in node debugger
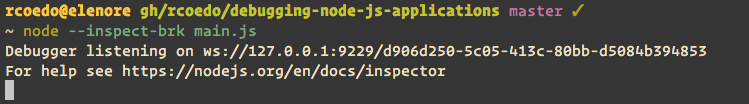
Many people don’t know it, but Node.js comes packed with its own debugging client. We can run the previous example in debug mode using the command node inspect:
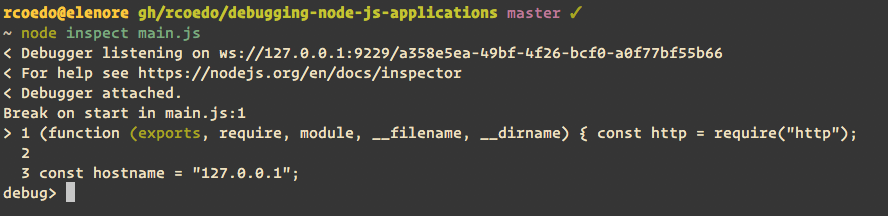
The code execution stops at the start of the script. The prompt changes to debug>, and we can start typing some commands. Typing help will print a list with all the available commands.
Next, we are going to set a breakpoint inside the request handler. We use the setBreakpoint function to set a breakpoint in line seven. Then we use the cont function to let the code execution flow.
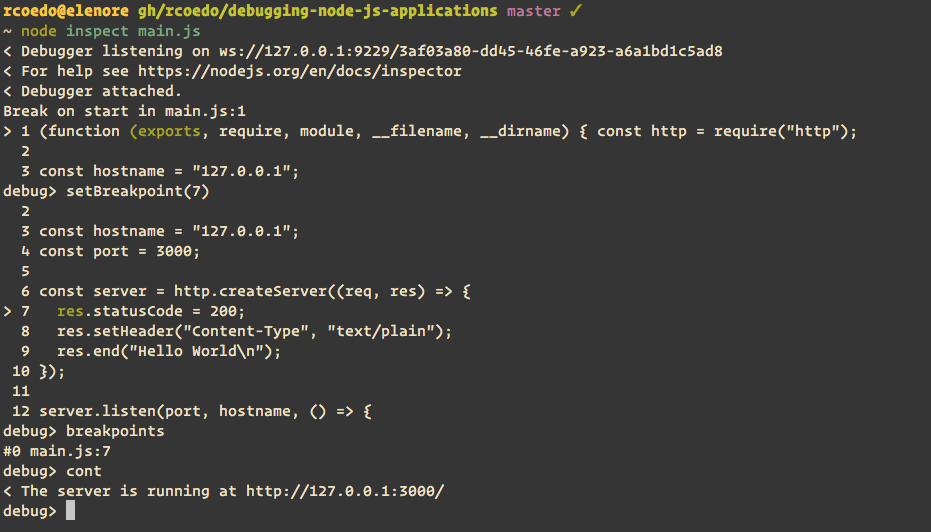
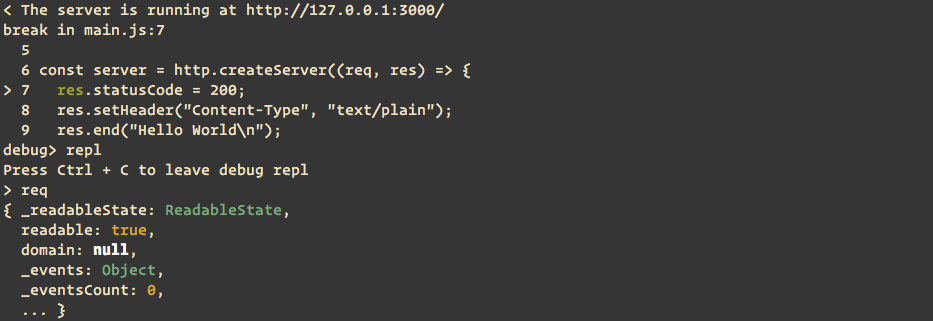
We can now go to http://localhost:3000/, and the script will stop at the request handler. Once it halts, we use the repl command to launch a REPL. This REPL will let you evaluate expressions in the current context.
There are many other useful commands in the built-in inspector, but we will not cover them here. The built-in debugger is excellent when we need a quick debugging tool, but there are better clients.
Using third-party debuggers
Our previous example used node inspect to run our code. This command tells Node.js to run our code listening for inspector commands via WebSockets on ws://localhost:9229/, and then it runs the built-in debugging client connected to that socket.
We can use the --inspect or the --inspect-brk CLI flag to just run the code in debug mode and then use a third-party debugger to attach to the inspector. The only difference between the two is that --inspect-brk stops the execution at the beginning of the script, and the –inspect does not.
Chrome Developer Tools
We can attach to the running process using the Chrome Developer Tools. With the debugger listening, go to chrome://inspect, and you will see something like this:
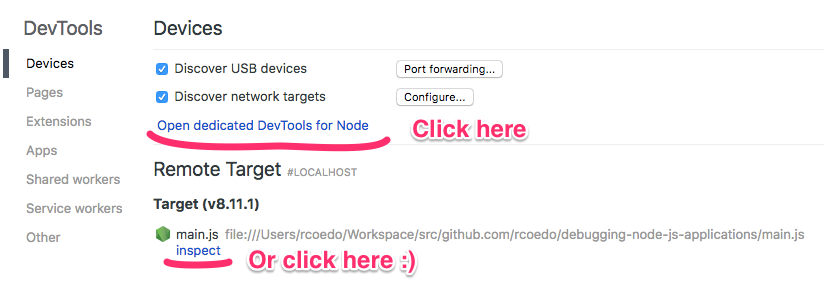
Clicking the link will open the Chrome Developer Tools window and automatically attach the debugger to the running process. We can do mostly the same things we could do with the built-in debugger, but the interface is way better.
If you are using macOS, You can use this small script to open the node.js Chrome Developer Tools directly from the command line.
Visual Studio Code
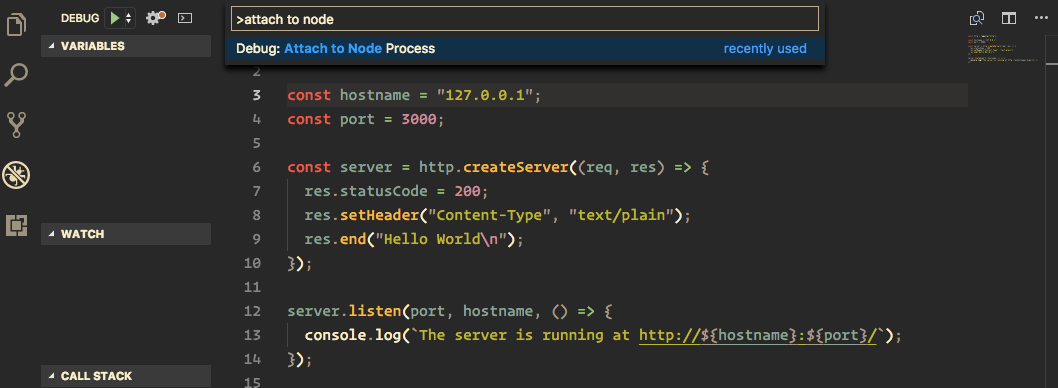
We could also use Visual Studio Code to attach to the node process. To do this, open your script with vscode, press SHIFT+CMD+P, and type attach to node process. This will list all the processes you can attach to. Choose the process listening to port 9229, and you will be ready to debug.
Using ndb
Ndb is a new node debugger done by Google. It uses Puppeteer to launch the Chrome Developer Tools but has some nifty extra features.
You can easily install ndb with npm or yarn:
$ npm i -g ndb
Once installed, just prepend ndb before the command you want to debug, and the Chrome Developer Tools will automatically open attached to the process:
$ ndb node main.js
Wrapping it up
This post taught us how to attach our debugger to a node process. In the next part of this series, we will cover the basics of the Chrome developer tools and use the debugger to fix a simple bug.
Enjoy!